
Start from evidence
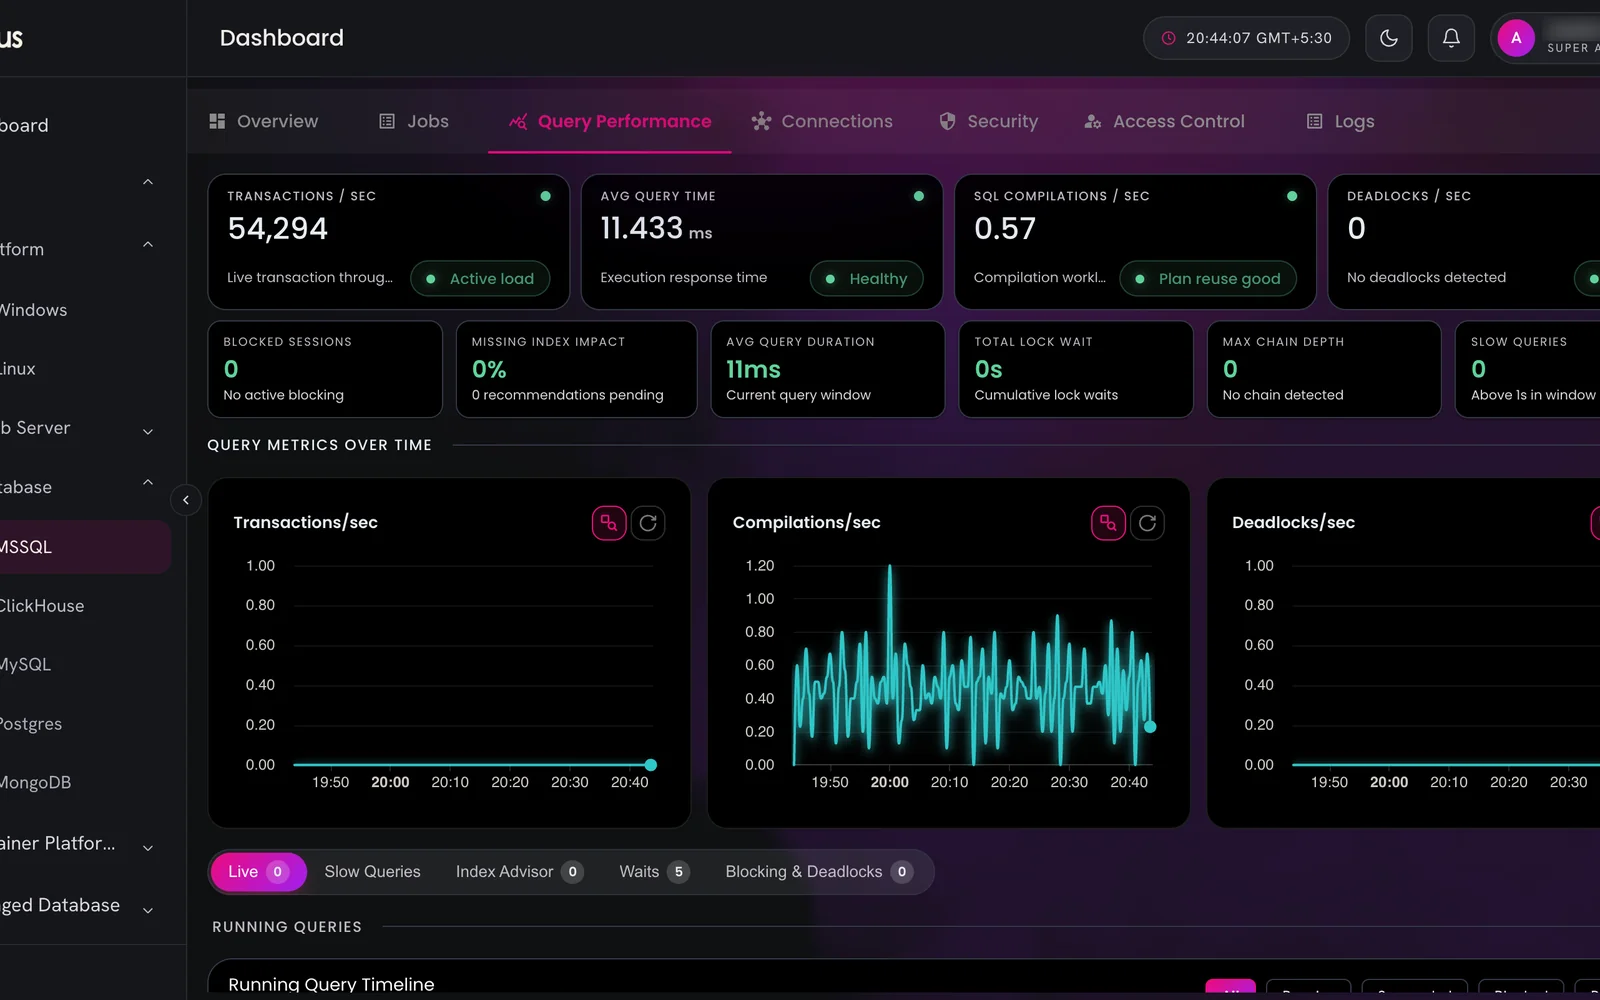
We capture a baseline of query latency, throughput, waits and resource use under real load. Tuning priorities come from the workload, not from generic checklists.
Find out exactly why a database is slow, fix the queries, indexes and settings that matter most, and prove the improvement with before-and-after measurements.
We trace slow user journeys down to the statements, plans and waits that cause them, then fix what moves the numbers most.
Teams usually come to us in one of these situations.
Pages and APIs that slow down as data grows or traffic peaks.
Oversized instances bought to hide inefficient queries.
Products that need confidence they will cope with new load.
Measure latency, throughput, waits and resource use under real load.
Rank the top statements by total cost and find their root causes.
Indexes, query rewrites, statistics, configuration and partitioning.
Compare against the baseline and add regression guards.
We capture a baseline of query latency, throughput, waits and resource use under real load. Tuning priorities come from the workload, not from generic checklists.
Most gains come from a small number of queries: missing or unused indexes, inefficient joins, N+1 patterns and plans that changed after a data or version change.
Regression checks, plan monitoring and capacity forecasts help the improvements survive the next release and the next year of data growth.
We tune each engine on its own terms: wait statistics and Query Store on SQL Server, EXPLAIN ANALYZE, vacuum and bloat on PostgreSQL, InnoDB and the slow log on MySQL, the profiler and indexes on MongoDB, and merges and partitioning on ClickHouse.
Where useful, we replay or simulate realistic load to confirm improvements and find the next bottleneck, then forecast when you will need more capacity.
Real problems we are asked to fix, what we do about them and the result to expect.
The situation
We capture the workload during peaks, find the queries and locks that degrade under load, and fix indexes, plans and batch schedules.
Consistent speed when it matters most
The situation
We measure where CPU, memory and I/O really go, remove inefficient queries, and right-size the instance only after the waste is gone.
Better performance on smaller hardware
The situation
We rework reporting queries, add read replicas or snapshots, and separate analytical load from transactions.
Reports and customers no longer compete
The situation
We load test realistic traffic, tune the bottlenecks we find and give you a capacity plan with clear headroom numbers.
Launch with known limits, not hope
The statements that matter most, measurably faster against a baseline.
Less CPU, I/O and memory per request, often allowing smaller instances.
Regression checks so improvements survive future releases.
Often the biggest wins come from indexes and configuration alone. Where query rewrites help, we prepare and test them with your developers.
Changes are tested on a copy or staging environment first and applied through your change process with rollback steps.
Yes. Amazon RDS, Aurora, Azure SQL and Cloud SQL expose parameters, performance insights and query statistics that we use the same way.
A focused engagement typically runs two to four weeks, from baseline to verified improvements, depending on the size of the workload.
Often yes. Indexes, statistics and configuration can help even when the application's queries cannot be changed.
No fixed figure is promised before measuring. We share expected impact per change and report the measured result.
Request a scoped cloud assessment, or start with a free DevOps and SRE consultation. Talk to us about services, AI solutions or enterprise development.