
Monitoring & Observability

See your whole estate in one place, from server and database health to Kubernetes, ECS and AI applications, so a slow service is understood and fixed before it becomes a customer incident.

One view from the server to the customer impact

Most outages are not a mystery. The signals were there, but spread across tools nobody had time to correlate. We bring infrastructure, database, container and application telemetry together, tune alerts so they mean something, and give every alert an owner and a runbook.

  • Fewer, better alerts with clear ownership
  • Dashboards that link resource use to latency and errors
  • AI-assisted investigation, reviewed by engineers
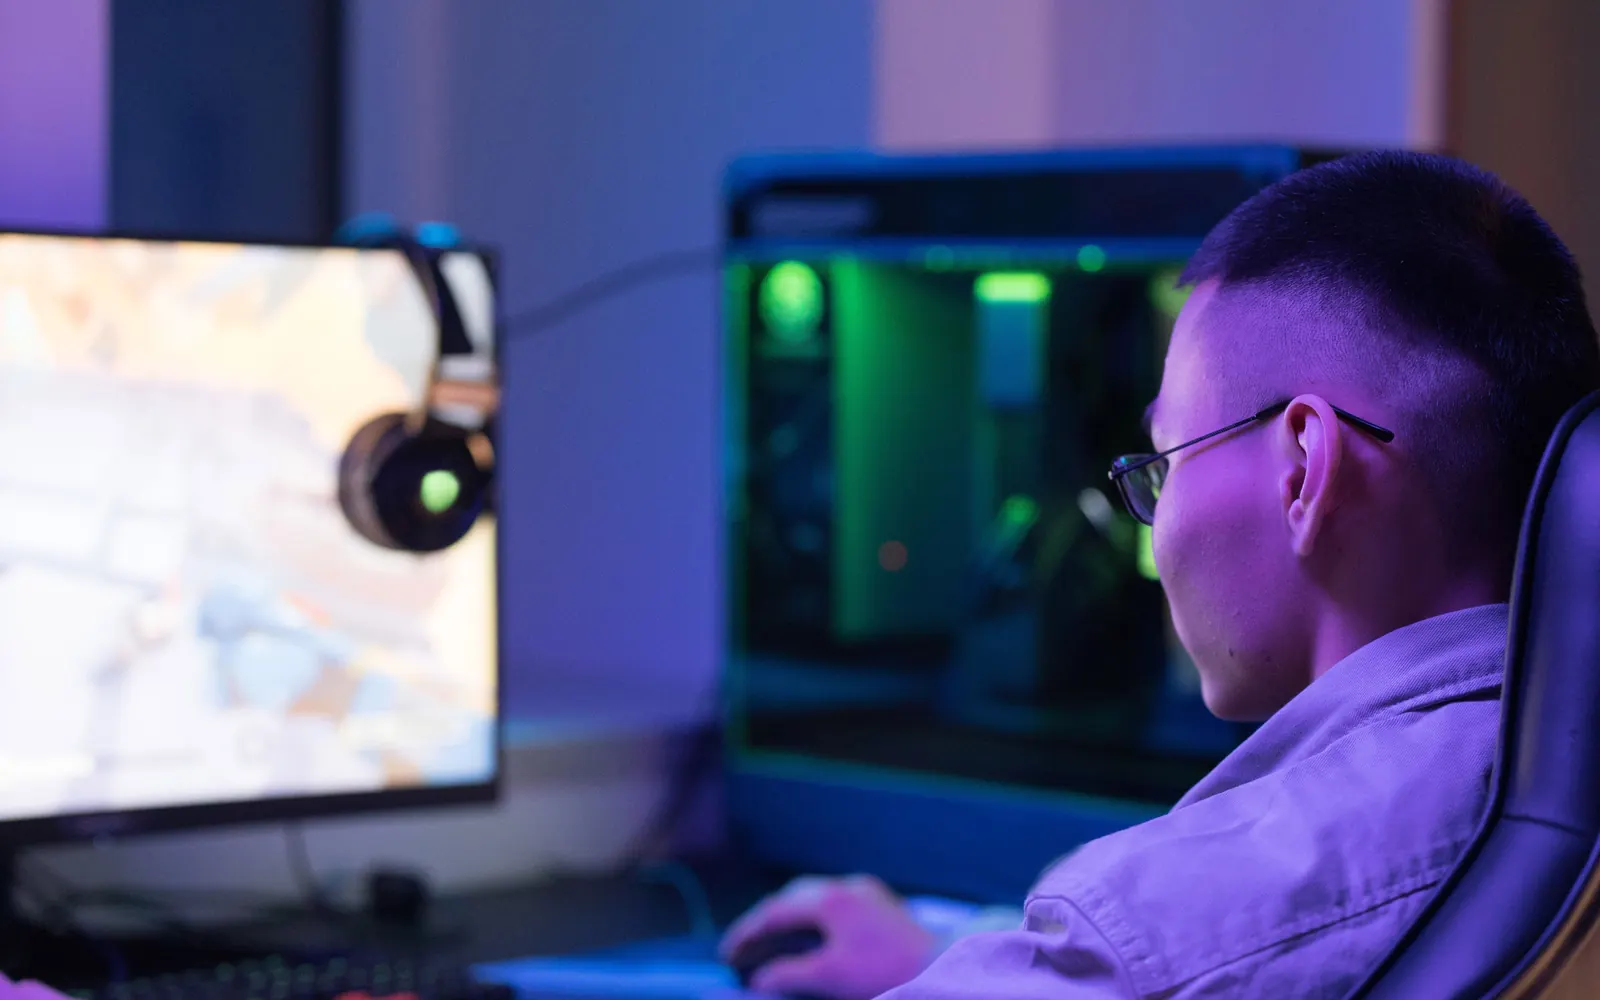
Engineer watching live monitoring dashboards on multiple screens

Who it's for

Teams usually come to us in one of these situations.

  • Teams drowning in alerts

    On-call engineers paged for noise while real problems slip through.

  • Fast-growing platforms

    More servers, databases and containers than the current tooling can explain.

  • Regulated businesses

    Teams that need monitoring data kept in their own region or environment.

Everything we monitor, in one practice

Pick the areas you need today. They share the same alerting, dashboards and incident workflow.

Infrastructure & AI-driven monitoring

Understand infrastructure health before a slow service becomes a customer incident. Linuxoft helps Canadian teams connect server, cloud and application telemetry to practical incident response workflows.

  • Linux & Windows
  • Cloud VMs
  • Network
  • AIOps

Monitor the signals that explain customer impact

We scope CPU, memory, storage, network and application health monitoring around the services your customers depend on. Dashboards connect resource utilisation with latency, error rates and availability so engineers can distinguish a busy server from a failing service.

AI-assisted investigation with human review

AI-driven monitoring can help group related alerts, identify unusual behaviour and summarise incident context. We assess the available telemetry and integrations before proposing automation. Engineers review suggested causes and remediation; production changes follow your approval process.

From alert delivery to incident ownership

An engagement starts with a telemetry and alert audit, then defines collection, retention, dashboards, escalation rules and runbooks. We can connect an Argus observability assessment with your existing monitoring stack. Outcomes are measured through alert quality, investigation time and service reliability.
Database & cloud database monitoring

Find the database conditions behind slow applications, capacity pressure and availability risks. Linuxoft helps Canadian businesses monitor self-managed databases and managed cloud database services.

  • SQL Server
  • PostgreSQL
  • MySQL
  • ClickHouse
  • RDS & Aurora

Connect database health with application performance

We review query latency, slow queries, connections, locks, deadlocks, replication lag and resource utilisation. The collection plan depends on the database engine and permissions available. SQL Server, PostgreSQL, MySQL and ClickHouse workloads need different signals and thresholds.

Monitor managed databases in the cloud

For services such as Amazon RDS, Aurora and Azure SQL, we combine cloud metrics with available engine diagnostics. Storage growth, I/O limits, connection saturation and maintenance events are reviewed alongside application demand. We agree access permissions before connecting production systems.

Turn monitoring findings into a database plan

Deliverables can include database dashboards, actionable alerts, a prioritised query tuning backlog and capacity recommendations. Backup job status and replication health are useful signals, while restore testing remains a separate operational task. Ongoing DBA support can own the agreed maintenance and investigation workflow.

Kubernetes monitoring

Connect cluster health with the applications running inside it. Linuxoft helps teams investigate Kubernetes failures, improve alerting and understand resource demand across managed and self-managed clusters.

  • Amazon EKS
  • Azure AKS
  • Google GKE
  • Self-managed

See failures across the cluster

We review node conditions, pod restarts, pending workloads, OOM kills, deployment events and service availability. Kubernetes events provide context that resource graphs alone cannot explain, particularly when a release changes scheduling or startup behaviour.

Bring application and resource signals together

Monitoring should show whether latency or errors are associated with resource limits, ingress, dependencies or a recent deployment. We assess metrics, logs and tracing integrations along with permissions and telemetry overhead. Collection is scoped to your EKS, AKS, GKE or self-managed environment.

Build an operational baseline

Typical work includes a cluster monitoring assessment, dashboards, workload alerts and investigation runbooks. Requests, limits and autoscaling policies are reviewed against observed demand. Cost recommendations account for reliability requirements and are validated before rollout.

Amazon ECS & Fargate monitoring

Understand why an ECS service is unhealthy, a task stopped or an application is slow. Linuxoft connects AWS service signals with container and application context for incident investigation.

  • ECS on EC2
  • Fargate
  • Task health
  • Deployments

Follow ECS service and task health

We review desired versus running tasks, deployment events, stopped-task reasons, health checks and load balancer target health. The monitoring scope distinguishes Fargate workloads from ECS on EC2 because host access and available signals differ.

Connect logs, metrics and deployments

CloudWatch logs and metrics can be combined with application telemetry to explain service behaviour. CPU, memory, network and error patterns are considered alongside task definitions and release events. Log retention and access permissions are agreed during onboarding.

Improve the response to container incidents

Deliverables can include ECS dashboards, alerts for unhealthy services, deployment investigation runbooks and capacity recommendations. We review autoscaling and task sizing against real demand. Any changes to running services are scoped with rollback and validation steps.

AI security monitoring & attack defence

Assess how attackers could misuse an AI application and how your team would respond. Linuxoft helps scope defence controls and monitoring around model access, application tools and sensitive data.

  • Prompt injection
  • Tool permissions
  • Abuse detection

Map threats to the application architecture

An AI attack defender should be designed around concrete risks: prompt injection, excessive tool permissions, data exposure, abusive traffic and unsafe downstream actions. We review trust boundaries, model integrations and available audit logs before recommending controls.

Build layers of prevention and detection

Potential controls include scoped identities, tool allowlists, input validation, rate limits, output checks and review gates for sensitive actions. Monitoring can flag unusual usage and suspicious workflows for investigation. The selected controls depend on your application and do not guarantee that every attack is blocked.

Test the response before relying on it

A scoped engagement can produce a threat assessment, a control backlog, security event requirements and response runbooks. Authorised testing checks how the application handles relevant abuse scenarios. Findings are prioritised with your engineering team and validated after changes.

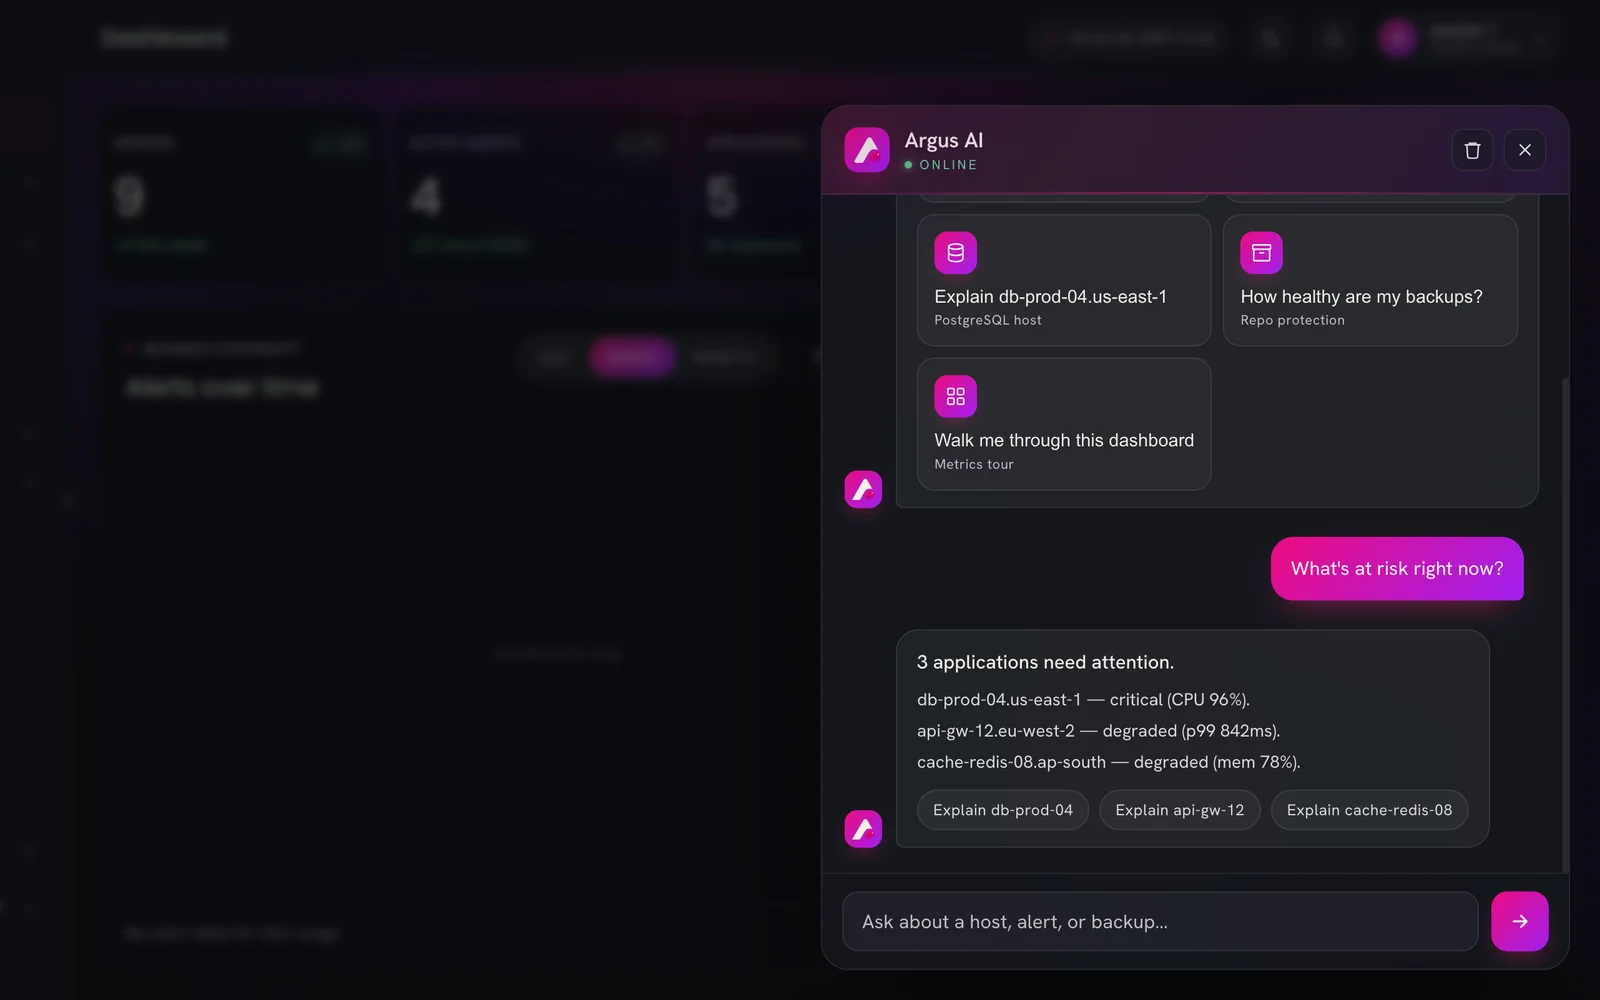
Powered by Argus, our server operations platform

Argus discovers servers, databases and containers automatically, monitors them in real time and explains incidents with AI root-cause analysis. It is how we run monitoring for our own clients, and you can use it too.

Argus AI assistant explaining which applications need attention

Common situations we solve

Real problems we are asked to fix, what we do about them and the result to expect.

  • The situation

    Customers report outages before your alerts do

    We add uptime, latency and error-rate checks on the journeys customers actually use, and alert on symptoms rather than raw CPU.

    Problems caught before the first support ticket

  • The situation

    Hundreds of alerts a day and nobody trusts them

    We audit every rule, remove duplicates, set thresholds from real baselines and attach an owner and runbook to each alert that stays.

    Pages that are rare, clear and actionable

  • The situation

    A slow database is dragging the whole application down

    Query-level monitoring shows the statements, locks and waits behind each slowdown, next to deployments and traffic changes.

    Root cause in minutes instead of hours

  • The situation

    Containers on EKS or ECS restart and nobody knows why

    We collect pod, task and node metrics, events and logs in one place, with alerts for crash loops, OOM kills and failed deployments.

    Clear answers for every restart

What you get

  • Fewer, better alerts

    Every alert has an owner, a threshold that means something and a runbook.

  • Faster investigations

    Metrics, logs and deployments in one timeline shorten time to root cause.

  • Clear service health

    Dashboards that show customer impact, not just CPU graphs.

How an engagement runs

  1. Telemetry & alert audit

    We map what you collect today, what fires, who gets paged and what nobody looks at.

  2. Collection & dashboards

    Agree signals, retention and dashboards for each service, database and cluster.

  3. Alerts & runbooks

    Actionable alerts with owners, escalation paths and tested runbooks.

  4. Review & improve

    Regular reviews of alert quality, investigation time and reliability trends.

More about this service

Coverage across clouds and on-premises

We monitor Linux and Windows servers, managed and self-hosted databases, Kubernetes on EKS, AKS and GKE, Amazon ECS and Fargate, web servers, queues and caches, whether they run on AWS, Azure, Google Cloud or in your own data center.

Monitoring as an ongoing service

Monitoring is not a one-time setup. We review alert quality, retire noisy rules, add coverage for new services and report on reliability trends every month, so the system keeps up with your architecture.

Frequently asked questions

Can Linuxoft improve an existing monitoring setup?

Yes. We can assess gaps in your current metrics, logs, dashboards and on-call workflows, then agree on integrations and changes without requiring a platform replacement.

Does AI monitoring automatically fix production incidents?

Automation depends on the approved scope. We recommend starting with investigation assistance and using reviewed runbooks and explicit controls for any production remediation.

Can cloud databases still have performance problems?

Yes. A managed service handles selected infrastructure tasks, but query design, indexing, connection usage, capacity and application behaviour still affect performance.

Is sensitive query data collected?

We agree the collection scope, access controls and retention before onboarding. Query text and logs may contain sensitive information, so collection and redaction need explicit review.

Do you support managed Kubernetes?

We can scope monitoring and operational support for Amazon EKS, Azure AKS and Google GKE, including the access and integrations available for each platform.

Can you monitor ECS Fargate without host access?

Yes. The collection approach uses the AWS service, container and application signals available to the agreed integration rather than assuming access to a host agent.

Can AI security controls replace application security?

No. Model-specific controls complement identity, secure development, infrastructure security and incident response. The overall system needs review.

Do I need to use Argus?

No. We can work with your existing monitoring stack. Argus, our own server operations platform, is available when you want discovery, monitoring, AI root-cause analysis and operational actions in one console.

How long does it take to get monitoring in place?

Most environments have core server and database coverage within one to two weeks. Kubernetes, ECS and application tracing follow in agreed phases.

Which tools do you work with?

Argus, Prometheus, Grafana, OpenTelemetry, CloudWatch, Azure Monitor and Google Cloud Monitoring, among others. We work with what you have before recommending changes.

Talk to us about Monitoring & Observability.

Request a scoped cloud assessment, or start with a free DevOps and SRE consultation. Talk to us about services, AI solutions or enterprise development.

Canada · Headquarters

Ontario, Canada

+1 416 988 4682sales@linuxoft.com

India · Global Delivery Center

Bangalore, Karnataka

+91 90253 36334sales@linuxoft.com
1/2
Your details
Your project

By submitting, you agree to our Privacy policy.