A single source of operational truth
Infrastructure telemetry from Argus or your existing tools, application metrics, deployments and business events land in one analytical store, modelled so the same question always gets the same answer.
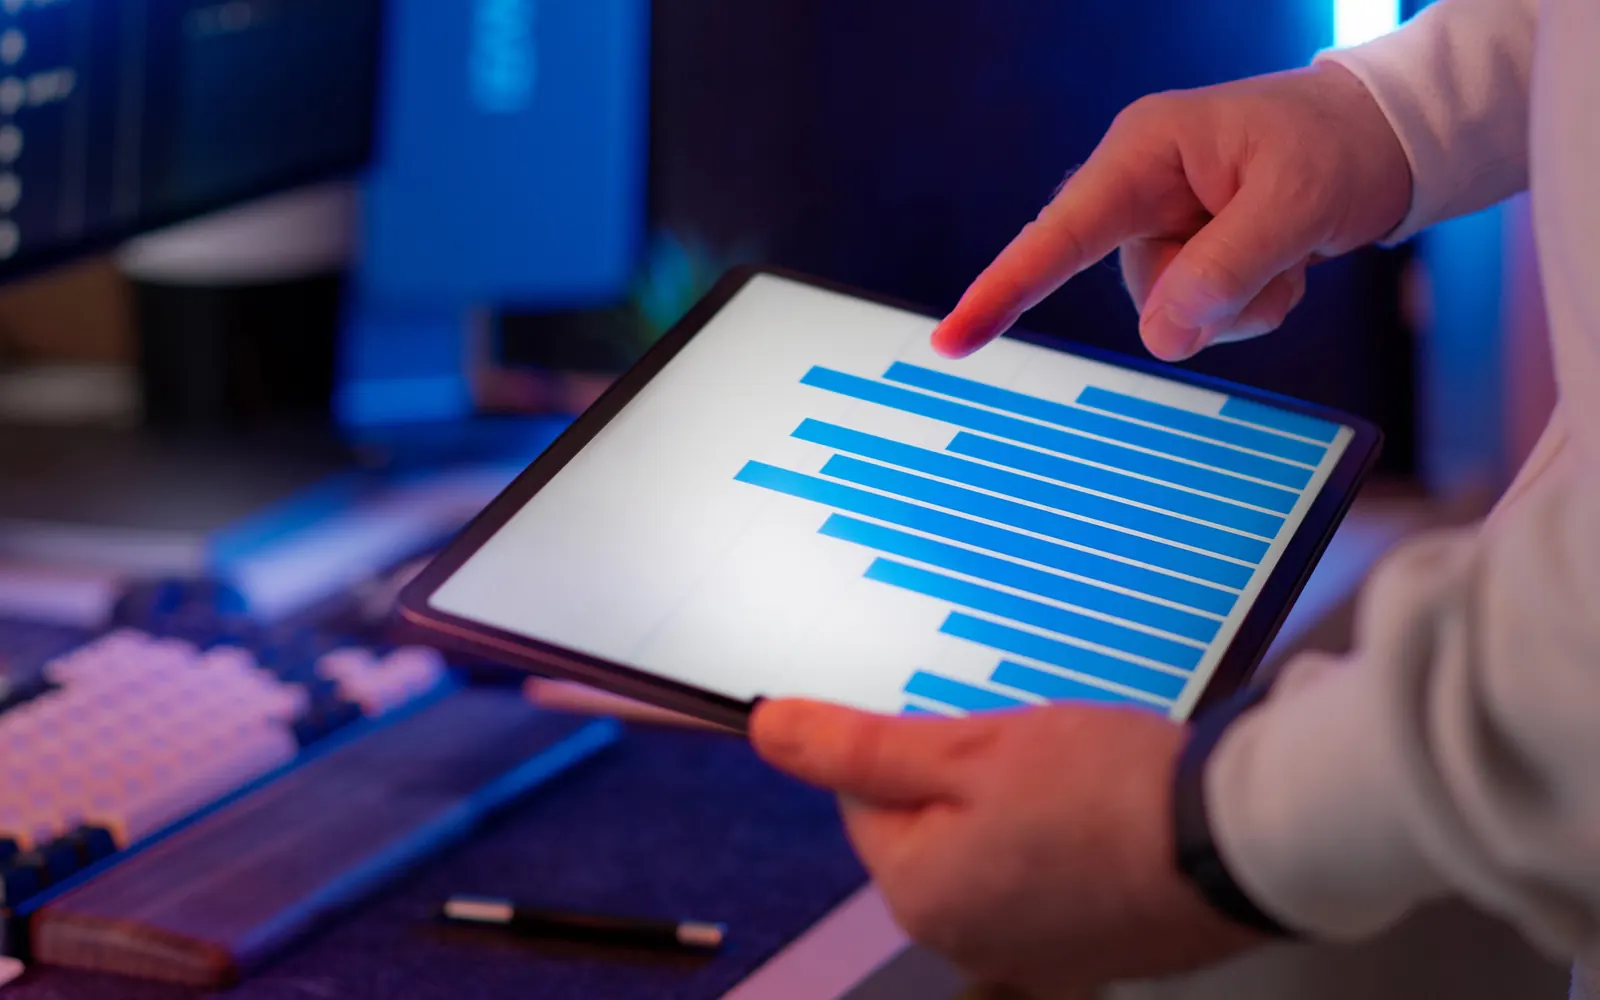
Enable smarter decisions with actionable analytics, infrastructure visualization and predictive monitoring, built on data platforms that answer questions in seconds.
Organisations usually come to us for this in one of these situations.
Teams responsible for uptime and capacity who still piece together answers from several tools.
Executives and managers who wait days for reports that are out of date when they arrive.
Companies whose data volumes have outgrown spreadsheets and the reporting built on the production database.
We connect infrastructure, application and business data into fast analytical platforms, then build the views and forecasts that operations and leadership actually use.
Metrics, logs and events in one queryable store.
Visual topology of services, databases and dependencies.
Trend-based alerts for capacity, latency and errors.
Spend broken down by team, service and environment.
Teams answer their own questions without waiting on reports.
Natural-language summaries of what changed and why.
What data exists, where it lives and who uses it.
Reliable ingestion into a fast analytical store.
Shape data around the questions people ask.
Dashboards, forecasts and alerts that drive action.
Real problems we are asked to fix, what we do about them and the result to expect.
The situation
We forecast CPU, storage, connections and cost from historical trends and alert weeks before limits are reached.
Capacity planned, not panicked
The situation
We bring metrics, logs, events and deployments into one store and build service-level views that show impact first.
One place to start every investigation
The situation
We automate the pipelines and replace manual reports with live dashboards and AI-written weekly summaries.
Reports that build themselves
The situation
Trend-based and seasonal anomaly detection flags unusual latency, errors and spend before thresholds are breached.
Earlier warnings, smaller incidents
Infrastructure telemetry from Argus or your existing tools, application metrics, deployments and business events land in one analytical store, modelled so the same question always gets the same answer.
ClickHouse and similar OLAP engines answer questions over billions of rows in under a second, so dashboards stay interactive as data grows.
Once the data is reliable, we add forecasting for capacity and cost and anomaly detection for performance and errors, tuned to your seasonal patterns.
Role-based dashboards for engineers, managers and executives, plus plain-language AI summaries that explain what changed and why it matters.
Live, trusted numbers instead of week-old spreadsheets.
Forecasts and anomaly alerts flag issues weeks earlier.
Automated pipelines and AI summaries replace hand-built reports.
Not necessarily. We often start with a focused analytical store for operational data and grow from there.
Yes. We integrate with your current tools, and Argus can supply infrastructure telemetry where needed.
Cloud provider metrics and billing, Argus and other monitoring tools, application logs and traces, databases, ticketing systems and business applications through APIs or change data capture.
Grafana, Metabase, Superset, Power BI and Looker Studio among others. We build on what your teams already know where possible.
Accuracy is measured against actuals and shared openly. Forecasts are tuned over the first few weeks and improve as more history accumulates.
You do. Everything runs in your cloud accounts, defined in code and documented, with optional ongoing support from us.
Request a scoped cloud assessment, or start with a free DevOps and SRE consultation. Talk to us about services, AI solutions or enterprise development.